Oakland Nonlinear Max Heart Rate Calculator & Training Zones (2026)
Most formulas assume your max heart rate declines at a fixed rate every year. The 2007 Gellish study from Oakland University found it doesn't. The decline accelerates.
Enter your age to get your Oakland nonlinear MHR and all 5 training zones instantly.
Oakland Max HR
--bpm
Zone 2 Range
--bpm
★ Sweet Spot
Your training zones
These zones use a percentage of max HR. For more accurate zones that also account for your resting heart rate, try the Karvonen calculator.
What Is the Oakland Nonlinear Formula?
The Oakland nonlinear formula is a quadratic max heart rate prediction equation developed at Oakland University in Rochester, Michigan. Ronald L. Gellish, Brian R. Goslin, Ronald E. Olson, and colleagues published it in Medicine & Science in Sports & Exercise in 2007. The study was longitudinal: 132 participants completed 908 graded exercise tests at Oakland University's health-assessment and fitness center between 1978 and 2003, meaning the same individuals were tracked repeatedly over time rather than measured once and compared across ages.
Max Heart Rate = 191.5 − (0.007 × Age²)
The same study also produced a linear formula, 207 − (0.7 × age), which the authors recommended for everyday use because it's simpler to calculate. But their own analysis showed the nonlinear equation provided a better statistical fit to the data. The quadratic term captures something the linear versions miss: the rate at which max heart rate declines isn't fixed. It speeds up as you age.
How the 3 Formulas Compare at Key Ages
All 3 formulas converge near 180 bpm around age 40. The differences are largest at the extremes of the age range.
Age
Oakland Nonlinear
Tanaka (208 − 0.7 × age)
220 Minus Age
20
189 bpm
194 bpm
200 bpm
30
185 bpm
187 bpm
190 bpm
40
180 bpm
180 bpm
180 bpm
50
174 bpm
173 bpm
170 bpm
60
166 bpm
166 bpm
160 bpm
70
157 bpm
159 bpm
150 bpm
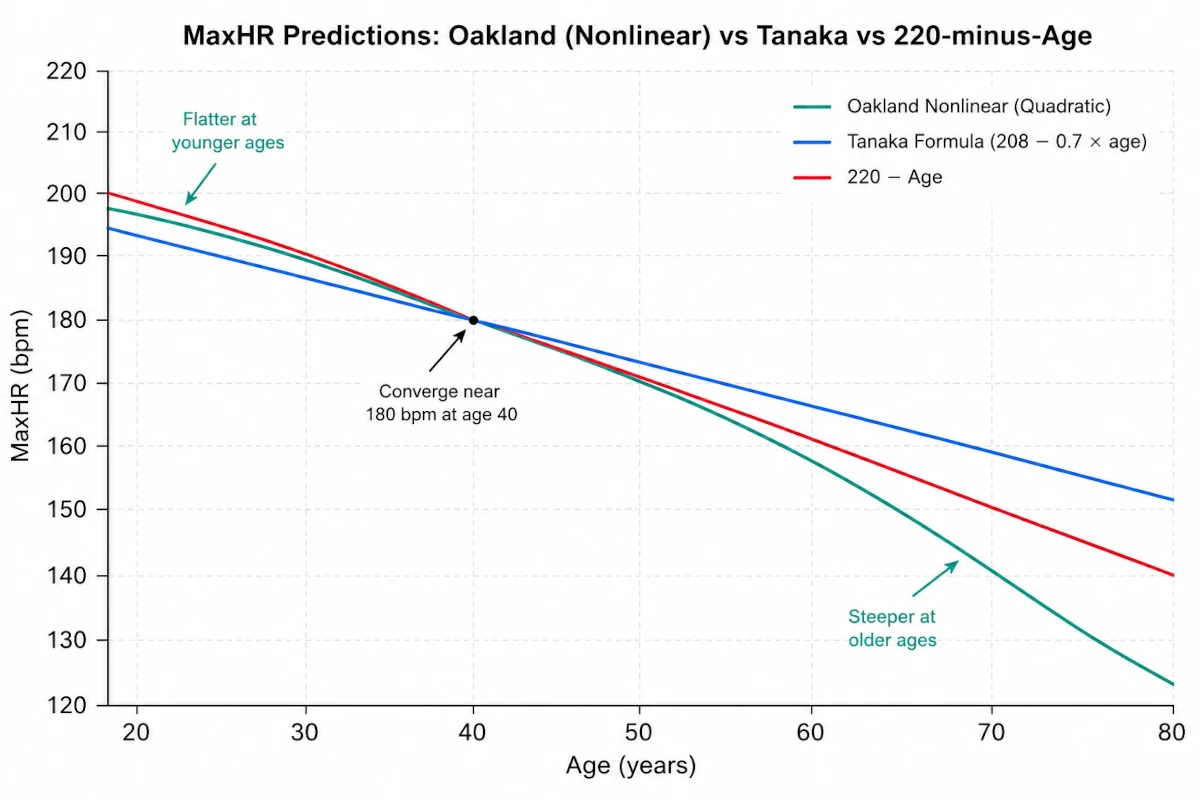
The convergence at 40 isn't a coincidence. That's roughly where a quadratic curve with these coefficients crosses the Tanaka line. Below 40, the Oakland formula gives lower estimates, reflecting the slower early decline it models. Above 40, it gives higher estimates than 220-minus-age, similar to Tanaka, because both outperform the older formula's over-steep 1 bpm per year assumption.
How the Oakland nonlinear curve compares to Tanaka and 220-minus-age across the lifespan. The three formulas converge near 180 bpm at age 40. The Oakland curve's changing slope reflects the accelerating nature of MHR decline — something neither straight line can capture.
Zone 1: Recovery (50–60%)
Active recovery, warm-ups, and cool-downs. Very light effort. Clears metabolic waste without adding training stress.
Zone 2: Aerobic Base (60–70%)
Fat burning, mitochondrial development, and aerobic base building. The conversational pace. This is where the majority of your training volume should live. How Zone 2 burns fat →
Zone 3: Aerobic Endurance (70–80%)
Sustained aerobic work that improves cardiovascular output and stamina. Moderate effort that still feels manageable for 30+ minutes.
Zone 4: Threshold (80–90%)
Lactate threshold training. Hard but sustainable. Improves the pace you can hold for a race or long hard effort. Limit this to 1–2 sessions per week.
Zone 5: Max Effort (90–100%)
All-out sprint intervals. Short, intense, and demanding on recovery. Use sparingly, no more than once a week for most people.
Why the Curve Shape Matters
Every age-based MHR formula makes an assumption about how fast your heart rate declines per year. Linear formulas lock in a fixed rate. The Oakland nonlinear formula says that rate changes with age, and the longitudinal data backs it up.
📋
Longitudinal, not cross-sectional
Most heart rate studies measure different people at different ages and compare them. This study tracked 132 of the same individuals through 908 tests over 25 years. That's a fundamentally more accurate way to measure how MHR changes with age.
📈
Accelerating decline built in
The quadratic age² term means the formula knows that losing 0.28 bpm per year at 20 isn't the same as losing 0.98 bpm per year at 70. The curve steepens. Neither Tanaka nor 220-minus-age models that.
📊
Better statistical fit
Gellish et al. tested both a linear and a nonlinear model against their data. The nonlinear equation fit better. The authors recommended the linear version for simplicity, but on accuracy, the curve wins.
✅
Age is the only input
Despite the more sophisticated math, you still only need your age. The calculator handles the quadratic computation instantly. You get a more nuanced estimate with no additional effort.
All age-based formulas carry roughly ±10–12 bpm of individual variation. No formula eliminates that. If you've recorded a peak heart rate during a race, a hard interval session, or an all-out effort and felt fine afterward, that number is almost certainly more accurate than any formula. Use it as your MHR input instead.
For a comparison of all the major age-based formulas, the Tanaka formula is widely cited as the most accurate linear option for mixed-sex adult populations. Women have a dedicated option in the Gulati formula, derived specifically from 5,437 women. For a broader look at how MHR estimates change across the lifespan, see the max heart rate by age guide.
Frequently Asked Questions
Common questions about the Oakland nonlinear formula and how to use it for training.
The Oakland nonlinear formula estimates maximum heart rate as 191.5 minus 0.007 times age squared. For a 40-year-old: 191.5 − (0.007 × 1,600) = 180 bpm. It was developed by Gellish and colleagues at Oakland University and published in Medicine & Science in Sports & Exercise in 2007. Unlike linear formulas, it uses a quadratic (curved) equation to model the accelerating nature of max heart rate decline with age.
Ronald L. Gellish, Brian R. Goslin, Ronald E. Olson, and colleagues at Oakland University, Rochester, Michigan. The study tracked 132 participants through 908 graded exercise tests at Oakland University's health-assessment center between 1978 and 2003. It was published in Medicine & Science in Sports & Exercise, 2007, Vol. 39(5), pp. 822–829. The same study also produced a linear formula, 207 − (0.7 × age), which the authors preferred for simplicity, though the nonlinear version fit the data better.
Linear formulas (Tanaka, 220-minus-age) assume your max heart rate falls by the same number of beats per minute each year, no matter how old you are. The Oakland formula rejects that. Because it uses age squared, the rate of decline gets faster as you age. At 20 you're losing roughly 0.28 bpm per year. By 50 that's 0.70 bpm per year. By 70 it's approaching 1.0 bpm per year. The decline doesn't stay constant. It accelerates, and the quadratic term captures that.
All 3 formulas converge near 180 bpm at age 40. Below 40, Oakland nonlinear gives somewhat lower estimates than Tanaka. Above 40, both Oakland and Tanaka give higher estimates than 220-minus-age, because 220-minus-age's steep 1 bpm per year decline consistently underestimates actual MHR in older adults.
Age 30: Oakland 185 bpm, Tanaka 187, 220-minus-age 190
Age 40: Oakland 180 bpm, Tanaka 180, 220-minus-age 180
Age 50: Oakland 174 bpm, Tanaka 173, 220-minus-age 170
Age 60: Oakland 166 bpm, Tanaka 166, 220-minus-age 160
Age 70: Oakland 157 bpm, Tanaka 159, 220-minus-age 150
The practical differences between Oakland and Tanaka are small at middle ages. The bigger story is how both outperform 220-minus-age at older ages.
The 5 zones as percentages of Oakland nonlinear max heart rate: Zone 1 (50–60%) recovery and warm-up; Zone 2 (60–70%) aerobic base building and fat burning; Zone 3 (70–80%) aerobic endurance; Zone 4 (80–90%) lactate threshold training; Zone 5 (90–100%) max effort intervals. For a 45-year-old with an Oakland MHR of 177 bpm, Zone 2 is roughly 106–124 bpm. Zone 2 is where most of your training volume should be, and it's worth knowing your exact range rather than relying on a rough guess. See the Zone 2 training guide for how to structure sessions around it.
On a statistical basis, yes: the Gellish et al. study found the nonlinear quadratic model fit their longitudinal data better than the linear formula they derived from the same dataset. In practice, the difference at middle ages is small (usually 1–2 bpm). Both formulas share the same fundamental limitation of all age-based equations: roughly ±10–12 bpm of individual variation. A directly measured peak heart rate from a race or all-out effort will always be more accurate than either formula. Use that number if you have it.
For serious training, the Karvonen method (our main calculator) is more accurate than any MHR percentage approach because it accounts for your resting heart rate. Two people of the same age with resting heart rates of 50 and 75 bpm have very different cardiovascular fitness levels, but raw MHR% zones treat them identically. That said, Oakland nonlinear% zones are a genuine improvement over 220-minus-age% zones. If you want the most accurate result without a lab test, use the Oakland formula's MHR estimate as your input to the Karvonen calculator.
❤️
Get Even More Accurate Zones
Pair the Oakland MHR with your resting heart rate using the Karvonen method. It accounts for your individual fitness level, not just your age.